Category Archives: Geography

The Sun Ain’t Gonna Shine (Anymore) – Maybe. Polar Exploration and the Mysterious Novaya Zemlya Effect

Sun's image distorted and elongated by atmospheric refraction ©Tim Jones
Sun’s image distorted and elongated by atmospheric refraction ©Tim Jones

A Polar Phenomenon

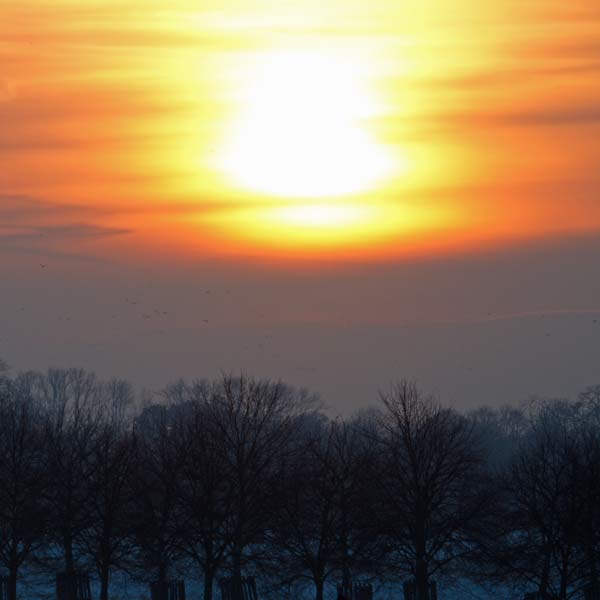
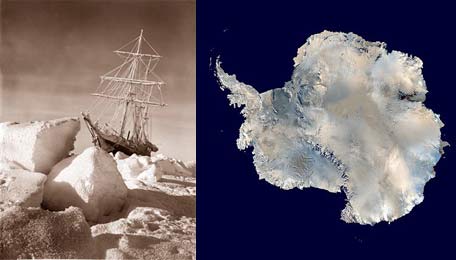
In May 1915, Ernest Shackleton and the crew of Endurance entered their fourth month trapped in the frozen Antarctic’s Weddell Sea. The ship’s navigator added to the gloom forecasting a sunless sky for the next seventy days.   You expect this at above 75° South. Then on the 8th of May something strange happened.  The Sun reappeared – several times:

The sun, which had made “positively his last appearance” seven days earlier, surprised us by lifting more than half its disk above the horizon on May 8.  A glow on the northern horizon resolved itself into the sun at 11 a.m. that day.  A quarter of an hour later the unseasonable visitor disappeared again, only to rise again at 11.40 a.m., set at 1 p.m., rise at 1.10 p.m.. and set lingeringly at 1.20 p.m.

Ernest Shackleton, 19151

Shackleton understood the effects of atmospheric refraction, that temperature and density differences can bend light, especially near the horizon.   At sunrise and sunset the Sun’s disk may appear lengthened or flattened, or displaced from its true position in the sky.

Endurance in Weddell Sea
Ernest Shackleton made his observations from the Endurance while frozen in the Weddell Sea (the bay top left)

Mariners knew of the phenomenon, referencing standard refraction tables to correct sextant readings for navigation; but the system broke down below about 6 degrees, where refraction increased rapidly and non-linearly.

How atmospheric refraction can make the Sun visible when it's still below the horizon ©Tim Jones
How atmospheric refraction can make the Sun visible when it’s still below the horizon ©Tim Jones

In this case, as Shackleton recorded in his journal, the Sun was 2 degrees and 37 minutes (2°37′) from its true position, 2 degrees more than the refraction tables predicted.  Plotting position from this observation would place the Endurance 120 miles from its actual location.

The Novaya Zemlya Effect

What Shackleton experienced was an extreme case of atmospheric refraction known as the Novaya Zemlya effect.

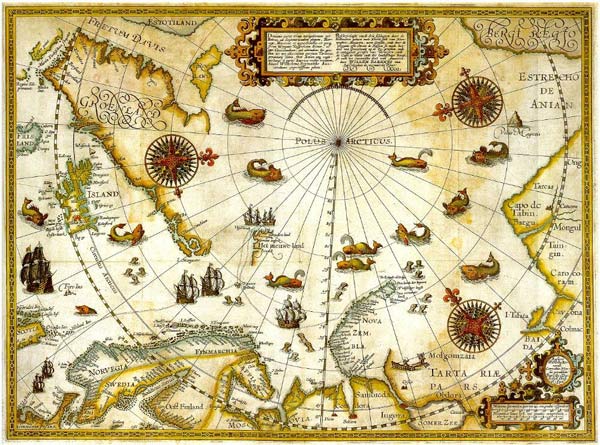
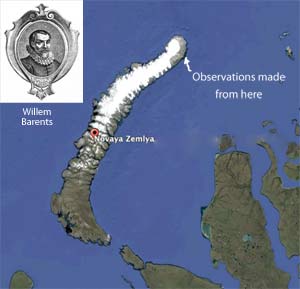
It was first reported in 1597 by Gerrit De Veer2 , one of the crew on Willem Barent’s third voyage to discover a north-east passage.  Obliged to hunker down for the polar winter in a safety hut or ‘Het Behouden Huijs‘ built on the Novaya Zemlya island chain north of Russia, De Veer reported the return of the post-winter Sun a whole two weeks before it should have been visible. It was in fact 5°26’ below the horizon.  The same thing happened two days later, the Sun still – by the book –  4° below the horizon.

Novaya Zemlya
Map depicting Willem Barents three voyages to discover a North East Passage, showing the Novaya Zemlya islands (Wikipedia)
novaya1

The Novaya Zemlya effect occurs in Arctic regions where tracts of cold air remain uniquely stable over hundreds of kilometers, creating a special instance of a  meteorological temperature inversion.  The distortion, powerful enough to bend light through four or five degrees, can make celestial bodies like the Sun or Moon appear wholly above the horizon when they are physically below it.  (If you imagine looking at the horizon, five degrees is the same as ten Suns or Moons in a row.)

For hundreds of years, nobody believed Gerrit De Veer’s solar observations, and equally his report of a curiously displaced conjunction of the Moon and Jupiter.  He must have counted the days wrong, or used the wrong sort of calendar.  It took the corroborating reports of polar explorers like Shackleton and, as recently as 2003, ray-tracing simulations3 using contemporary atmospheric data, to fully vindicate De Veer.

Modern almanacs still include refraction tables. (HM Nautical ALmanac Office)

Time Travel with Starry Night

I’ve set up my own simulations of the celestial events reported by Shackleton and De Veer using the planetarium software Starry Night.  The program can’t reproduce the ray traced refraction effects modeled by van der Werf et al3 – whose validity I’m not equipped to comment on by the way, but it’s still satisfying to check the published numbers and get a feel for what the events looked like all those years ago.

Shackleton’s Solar Observation

First up, the view from the Endurance in 1915:

View from Weddell Sea (Lat. 75 degree 23 mins S Long. 42 degree 14 mins W) 8th May, 1915, 1:20pm (UT) ©Tim Jones, Starry Night Software

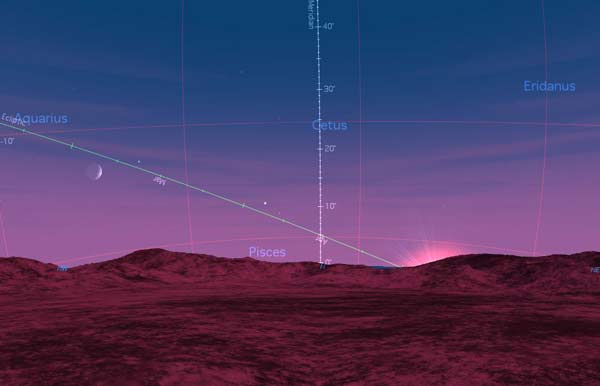
The horizon terrain here is generic Starry Night; apart from being icy-white, the true horizon would run perpendicular to and cross the graduated white Meridian line at zero (0) degrees.  The green line is the Ecliptic.  Things are clearer for our purposes, if less romantic, if we turn off the daylight effect and fancy terrain and zoom in a bit.  It’s now clear the Sun was below the horizon when Shackleton reported seeing it: i.e. with reference to the Meridian on the left, the Sun looks about two and half degrees below the zero degree mark (Shackleton’s 2°37′):

shackleton-120
View from Weddell Sea (Lat. 75 degree 23 mins S Long. 42 degree 14 mins W) 8th May, 1915, 1:20pm (UT). With generic landscape and daylight effect turned off ©Tim Jones, Starry Night Software


Gerrit De Veer’s Solar Observation

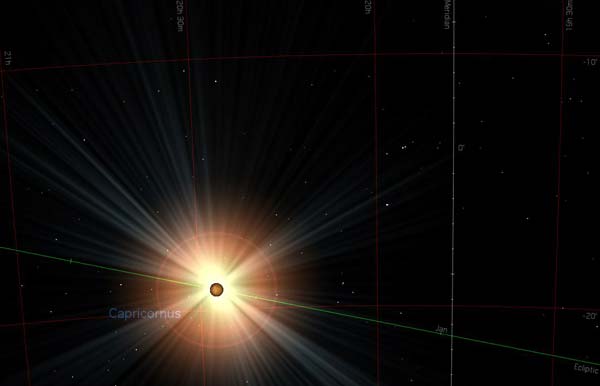
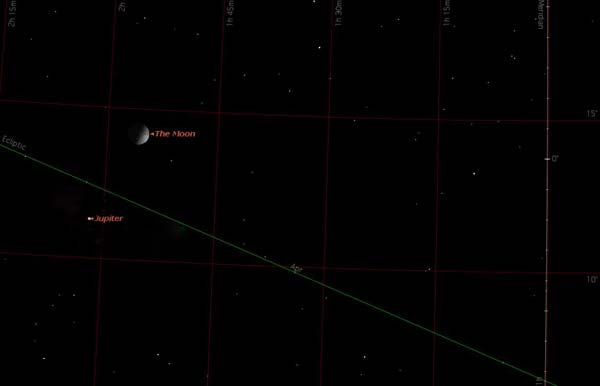
Willem Barent’s crew, marooned 300 years earlier at the opposite end of the planet, made their observations from the ‘Behouden Huijs‘ at coördinates 76° 15.4′ North 68°18.6’ East, Novaya Zemlya.  This view from the Huijs at 7 o’clock on the morning of 24th January 1597, shows the Sun was firmly below the horizon when Gerrit De Veer observed it – a whole 5°26′ below (horizon is perpendicular to the zero mark on the white Meridian line, green line is the Ecliptic):

Gerritt De Veer sunrise
View from the rescue hut on (Lat. 76 degree 15.4 mins N Long. 68 degree 18.6 mins W) 24th Jan, 1597, 7:00 am (UT). ©Tim Jones, Starry Night Software


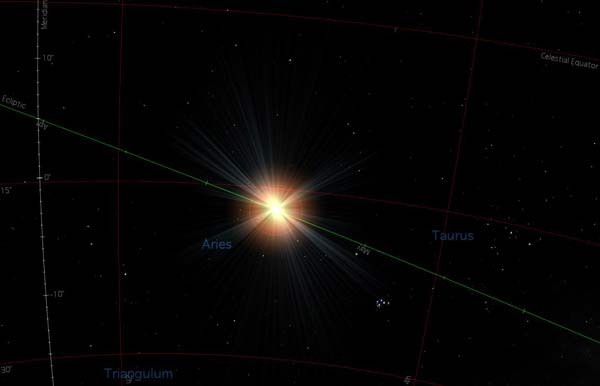
Gerrit De Veer’s Moon-Jupiter Conjunction

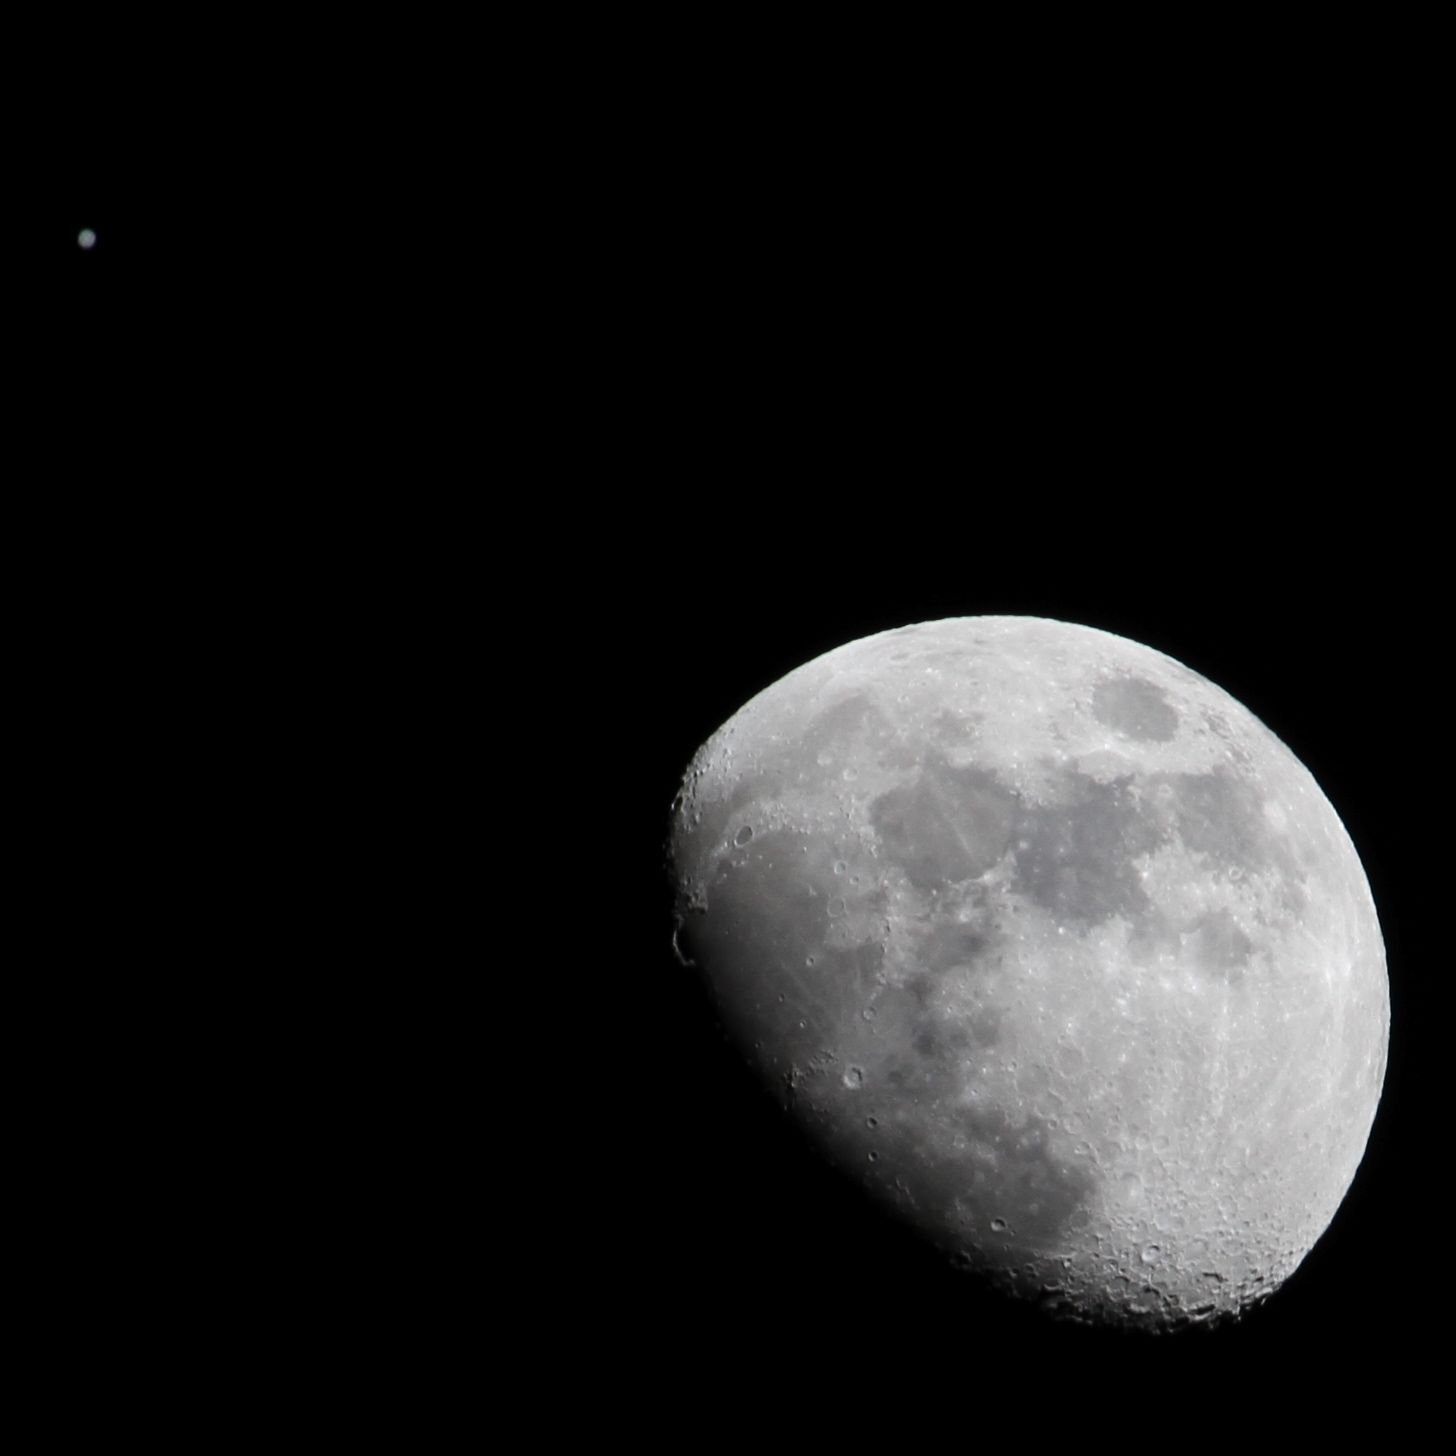
The Moon-Jupiter conjunction reported by De Veer physically happened at 0:14 UT on 25th January 1597 (there is a small error in the 0:24 UT time given in the contemporary tables by Scala that De Veer used).   Like astronomers today, De Veer identified the moment of conjunction as the time when a line drawn along the shadow separating light from dark on the moon’s surface, the terminator, pointed directly at Jupiter, as in this photograph I took of the Moon-Jupiter conjunction of 21 January 2012:

Moon and Jupiter, 18:45, 21.01.2012, Los Angeles ©Tim Jones

Starry Night simulation of the De Veer conjunction

De Veer's moon jupiter conjunction
Moon-Jupiter conjunction, 0:14 (UT) 25th Jan,1597. Location: the rescue hut on (Lat. 76 degree 15.4 mins N Long. 68 degree 18.6 mins W) ©Tim Jones, Starry Night Software

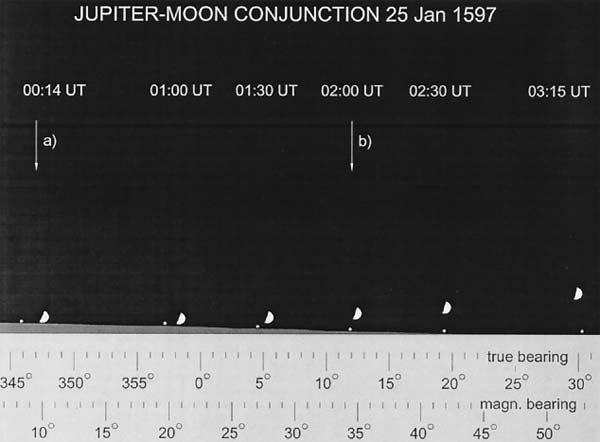
The Moon is barely above the horizon and Jupiter is below it (again, reference the zero on the white Meridian line).

Gerrit De Veer saw this view, but over an hour after it happened: i.e. at 01:27 UT not 00:14 UT.  As van der Werf’s analysis explains, De Veer reported the conjunction at 6 a.m. local time, which was 4:33 hours ahead of UT.  Such was the unbelievable power of the Novaya Zemlya effect to make this happen that few indeed believed it.   De Veer learned about the conjunction from his copy of the Ephemerides of Josephus Scala which gave times for Venice.  Here we pick up the story in De Veer’s own words and the spellings of his 1609 translator William Phillip:

Whereupon we sought to knowe when the same coniunction should be ouer or about the house where we then were; and at last we found, yt the 24 day January was the same day whereon the coniunction aforesaid happened in Venice, at one of the clocke in the night [= 1 in the morning of 25th Jan], and with vs in the morning when ye sun was in the east: for we saw manifestly that the two planets aforesaid approached neere vnto each other, vntill such time as the moone and Jupiter stood ouer the other, both in the sign of Taurus, and that was at six of the clocke in the morning;at which time the moone and Jupiter were found by our compas to be in coniunction, ouer our house..
Gerrit De Veer 1597

Yet ray tracing the scenario 400 years later, with Jupiter two degrees below the horizon and the Moon just above it at  conjunction, shows that atmospheric conditions raised Jupiter’s apparent position disproportionately to that of the Moon.  Moreover, the simulation reproduced what De Veer saw at the time he saw it: a conjunction visible to him at around 02:00 UT.  The ray tracing team made a further minor adjustment for the Equation of Time effect, which brought their estimate of when the conjunction was visible to De Veer as 06:20 local time, which is impressively close to his 06:00.)

Apparent position of Jupiter and the Moon after allowing for atmospheric refraction. Diagram reproduced from analysis by van der Werf et al, 2003 (reference 2)
Apparent position of Jupiter and the Moon after allowing for atmospheric refraction. Moon is double actual size for clarity. Diagram reproduced from analysis by van der Werf et al, 2003 (reference 3)

One More Thing

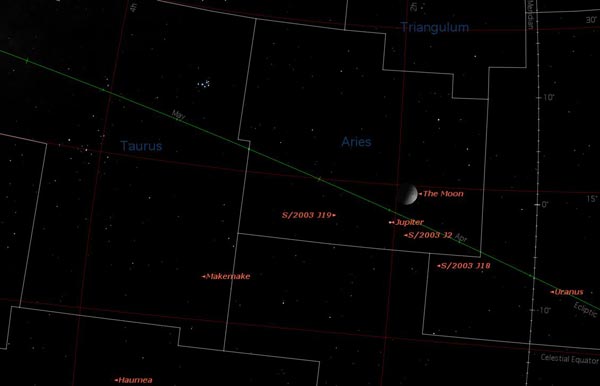
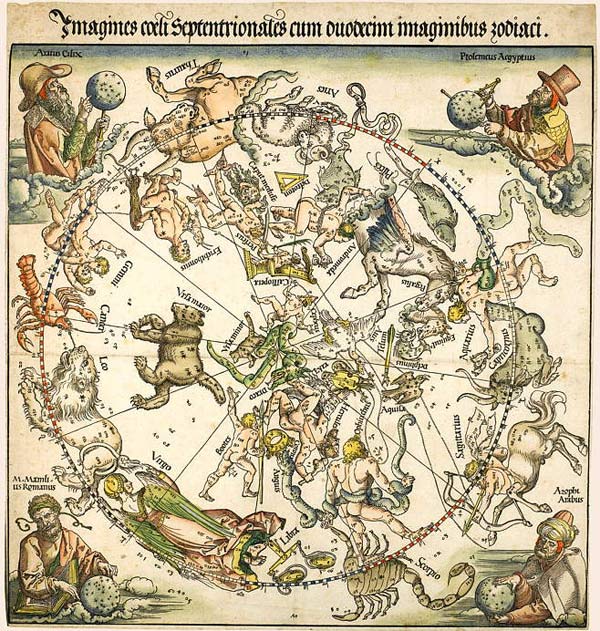
Although Gerrit De Veer’s vindication now seems complete, there was one little alarm bell went off during my research, concerning De Veer’s reference to both the Moon and Jupiter being in the constellation of Taurus at the time of conjunction.  Zooming in to see the 1597 conjunction against modern constellation boundaries puts it well into Aries.  So what gives?

constell
Modern constellation boundaries. Moon-Jupiter conjunction, 0:14 (UT) 25th Jan,1597. Location: the rescue hut on (Lat. 76 degree 15.4 mins N Long. 68 degree 18.6 mins W) ©Tim Jones, Starry Night Software

Maybe the constellation boundaries have changed; let’s have a look at Albrecht Dürer’s beautiful star chart from 1515.  Here we see the belly of the bull tucks a little further under the ram than in modern charts, but the conjunction is still firmly in Aries. 

Star chart of the northern skies, Albrecht Dürer, 1515, Nuremberg.

Maybe the Moon made the stars in Aries harder to see that night. That might cause De Veer to focus on the sparkling Pleiades and Hyades clusters in Taurus. (I’d probably do that if I were standing in a freezing Arctic wasteland staring at the sky at six in the morning.) 

Charles Beke4 also noticed the discrepancy in a 19th century analysis of the William Phillip translation.  He points to a retrogression of the equinoctial points – the places where the celestial equator intersects the ecliptic. Since De Veer’s day, this will have shifted the positions of the constellations in terms of longitude and latitude relative to those references. Although that suggests De Verre placed the conjunction in whatever constellation the numbers dictated, rather than where he saw it?  Still a bit of a mystery to solve then – at least in my mind.  

References

  1. E. Shackleton, South: The Story of Shackleton’s Last Expedition 1914–1917, MacMillan, New York, 1920
  2. Gerrit De Veer, The Three Voyages of William Barents to the Arctic Regions (1594, 1595 and 1596). London, 1876 (translation of 1609 original).
  3. Gerrit de Veer’s True and Perfect Description of the Novaya Zemlya Effect, 24-27 January 1597, Siebren Y. van der Werf, Günther P. Können, Waldemar H. Lehn, Frits Steenhuisen, and Wayne P. S. Davidson; Applied Optics, Vol. 42, Issue 3, pp. 379-389 (2003)http://dx.doi.org/10.1364/AO.42.000379
  4. Charles T. Beke, The Three Voyages of Willem Barents to the Arctic Regions 1594, 1595 and 1596 by Gerrit de Veer, 2nd ed.William Phillip, trans., Hakluyt Society, London, 1876 (Page 147)

A Groovy Kind of Rock

Glacier scarred morain rock near Llanberis (Photo:Tim Jones)
Boulder

A Short Vacation

On a winding stretch of the A5 road from North Wales to London – around Betys-y-coed and Llangollen – mountain scenery combined with the challenge of balancing speed, driver satisfaction, and passenger nausea makes the journey almost enjoyable.  On the other hand, the interminably boring alternations of dual-carriageway and roundabouts that follow – between Oswestry and Shrewsbury – are a recipe for brain death.

Except, that is, one day last week, returning prematurely from a weather-killed ‘Welsh Break’, my mind buzzed over two critical questions the whole trip: What would our broken tent cost to fix?  And why did the grooves on that boulder point to the North East?

Well spotted that woman at the back; this is a post where I obsess about a rock.

Snowdon (Photo:Tim Jones)
Boulder and Snowdon

Location relative to Wales
Location in Wales

Location relative to Llanberis

The boulder in question sits about a half mile down the old Rhyd Ddu road outside Llanberis in Snowdonia.  Its top surface is covered with North East-facing parallel grooves.

And that’s puzzling, because it looks like a moraine boulder dropped by a glacier, in an area where – having walked these valleys for years – I always assumed the ice had flowed towards the North West, away from Snowdon.  Seeing as though the scrape marks left by glaciers – which is almost certainly what these are –  align with the direction of glacial flow, something is amiss.

At this point, lest I raise galactic doubt and uncertainty beyond already dangerous levels, as Douglas Adams might say, rest assured this is all sorted – after a fashion but in a reasonably scientific way –  by the end of the post.  I also got a new tent pole: £15 – thanks for asking.

South Sea Wales

The relevant history starts around 400 million years ago with successive phases of volcanism, weathering, and glaciation (plus some folding and other geological processes).  When the oceanic plate of Iapetus undercut the adjacent tectonic plate of Avalonian – all in the Southern Hemisphere back then – the resulting subduction generated enough heat for volcanoes to punch through Avalonia and form the upland region we now call Snowdonia1.

Source: Wikicommons

Subduction Zone (Source:IAN Symbol Libraries)

The ensuing millenia saw wind, rain, and rivers transform the resulting mountain range from Himalayan grandeur to the more modest heights we see today; yet some of the most dramatic re-modelling was reserved for only the last 20,000 years or so.  And it was caused by ice.

20,000 years ago we were at the peak of a major ice-age that buried the whole region under 1.4 km of ice, with just the tops of the highest mountains poking out.  Moving under gravity, glaciers of rock-bearing ice flowed down the river valleys, gouging out the Llanberis, Nant Ffrancon, and other steep-walled passes, cutting through hard volcanic rock in a series of breaches, and scooping out rounded recesses, or cwms (known as corries in Scotland).

Llanberis Pass on the right, Cwm Brwynog to the left

View down Llanberis Pass from Llanberis (Photo: Tim Jones)
View down Llanberis Pass from Llanberis

Chunks of rock, liberated by repeated melting and expansion of ice, or plucked out by other rocks, joined the glacier and travelled as an abrasive slurry beneath the ice – scoring anything in their path, before being released as ‘moraine’ when the glacier descended to a warmer altitude or the general climate warmed up sufficiently for the ice to melt.

Boulders falling on the surface of the glacier were likewise dumped, sometimes in incongruous isolation, their angular forms undamaged – like this one just off the Snowdon Ranger Path:

Moraine boulder east of Snowdon near Snowdon Ranger Path / Llyn Ffynnon-y-gwas

A Popular Destination

Glacier-scarred morain rock near Llanberis, North Wales. Photo:Tim Jones
Did Darwin or Huxley pause at this one?

No shortage of historical figures are associated with glaciation and its geographical consequences, including: Louis Agassiz, Charles Lyell, Charles Darwin, Alfred Russel-Wallace, John Tyndall and Thomas Henry Huxley.  Agassiz observed glaciers in Switzerland, and in 1840 was the first to suggest similar processes had operated in the upland areas of Britain (an assertion on which he was closely supported by William Buckland and Charles Lyell.)

Charles Darwin knew the region well2:

“I cannot imagine a more instructive and interesting lesson for any one who wishes (as I did) to learn the effects produced by the passage of glaciers, than to ascend a mountain like one of those south of the upper lake of Llanberis, constituted of the same kind of rock and similarly stratified, from top to bottom. The lower portions consist entirely of convex domes or bosses of naked rock generally smoothed, but with their steep faces often deeply scored in nearly horizontal lines, and with their summits occasionally crowned by perched boulders of foreign rock.”

The glacial boulders of North Wales, with their strange grooving, made a particular impression on Alfred Russel Wallace, the co-discover with Charles Darwin of evolution; commenting in his paper Ice Marks in North Wales3:

..it frequently happens that grooves or scratches are made upon the rocks by the hard materials imbedded in the bottom or sides of the glacier. Owing to the enormous weight and slow motion of glaciers, they move with great steadiness, and thus the markings on rock-surfaces are almost straight lines parallel to each other, and show the direction in which the glacier moved.

and:

Nothing is more striking than to trace for the first time over miles of country these mysterious lines, ruled upon the hardest rocks, and always pointing in the same direction.

Suddenly I feel less alone in my fascination.

In his hugely popular textbook on physical geography – Physiography4 – Thomas Huxley describes how glaciers flow over exposed bedrock to produce characteristic Roches Moutonnees formations (sheep-backs), complete with parallel striations:

Roches Moutonnees, Colorado (from Huxley's Physiography, p.162, 1878)

The Mystery Solved?

But back now to the North West / North East question; a closer look at the Ordnance Survey and Google 3D map projections suggests an answer.

For directly to the South West of our boulder is a more local gouging of the hills in the form of Cwm Dwythwch and its attendant lake – Llyn Dwythwch, suggesting the area was subject to local glaciation running perpendicular to the main ice-flow from Snowdon.  Indeed, the feature is discussed in a paper from the 1950s describing the glaciation as a distinct event, separated from the main ice-flows by 10,000 years in the last period of UK glaciation – the ‘Loch Lomond Advance’.   The cwm certainly aligns with our boulder (pink X marks the spot):

Things are even clearer in glorious Google 3D, North at top:

or looking toward Snowdon:

In Late Glacial Cwm Glaciers in Wales5, Brian Seddon references Cwm Dwythwch and 32 other cwms or cirques in the region arguing they developed from snow and ice preferentially deposited on the sun-sheltered North and North Eastern faces of hillsides, assisted by snow-drifting induced by South Westerly prevailing winds (like we have today).  Seddon recorded the moraine fields of 33 such cirques, plotting their altitude(circles) and aspect(radii) to illustrate the dominance of North/North East facing cwms.  He placed the lowest extent of moraines in the Snowdon Group, containing Cwm Dwythwch, at 275 metres, which is above, but not far off, our boulder’s height at 240 metres.  Maybe he didn’t count every individual boulder at the boundary?  That Snowdonia was formed by a mix of ice-cap and localised glaciation is now widely accepted6,7.

Moraine altitude, aspect, direction in Seddon's Snowdon Group' After Seddon (Ref.5)

All of which, in conclusion, suggests our boulder most likely started life as a volcanic outcrop at the top of Cwm Dwthwch, was carried to its present position by a glacier in a secondary period of low temperatures and glaciation around 10,000 years ago, and picked up abrasions as it was overrun or carried in the North Easterly underflow.

All that with three qualifiers: (a) it’s not 100% certain the boulder is not actually an outcrop of bedrock (need to take a closer look next visit!); in which case it’s fair to assume it was simply overrun by the glacier; and (b) it’s possible the boulder was carried down from Snowdon in the first glacial episode and  subsequently overrun by the secondary glacier (again, more research); or even (c) the boulder  was scarred in the first episode and somehow got spun around 90 degrees just to fool us.

Clearly no rest for the rigorous –  or obsessive weekend geographers – it would seem.

p.s. If any seasoned geologists out there want to put me right / out of my misery, please feel free :-).

Basecamp with pre-broken tent

References / Sources

1. Rock Trails, Snowdonia: A Hillwalker’s Guide to the Geology and Scenery. Gannon, Paul. Pesda Press, 2008

2. Notes on the Effects produced by the Ancient Glaciers of Caernarvonshire, and on the Boulders transported by Floating Ice, Charles Darwin, The Edinburgh New Philosophical Journal, 1842, p.362.

3. Ice Marks in North Wales (With a Sketch of Glacial Theories and Controversies) Alfred Russel Wallace, Quarterly Journal of Science, January 1867

4. Physiography: An Introduction to the Study of Nature. T.H.Huxley, Macmillan, 1878, p.162.

5. Late Glacial Cwm Glaciers in Wales. Brian Seddon, Journal of Glaciology, 1957. In International Glaciological Journal, Volume 3, Issue 22 pp.94-96

6. The last glaciers (Loch Lomond Advance) in Snowdonia, North Wales. Gray JM 1982. Geological. Journal 17: 111-133.

7. Allometric development of glacial cirque form: Geological, relief and regional effects on the cirques of Wales, Ian S. Evans, Geomorphology Issues 3-4, 1986

8. The Early History of Glacial Theory in British Geology. Bert Hansen, Journal of Glaciology, Vol 9, No.55, 1970.