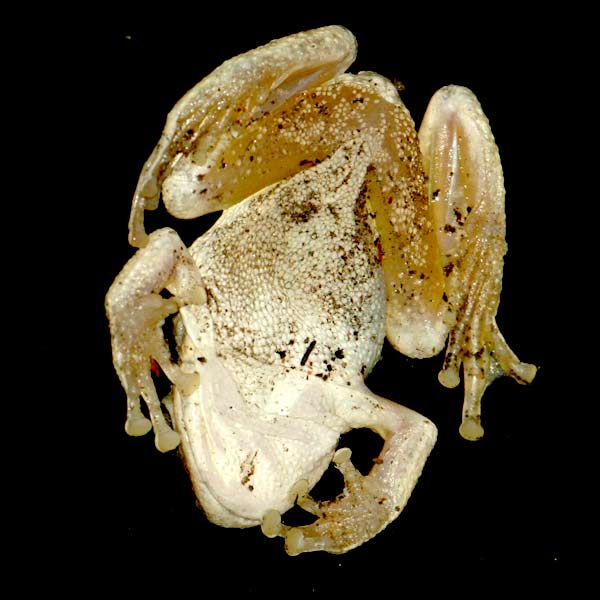
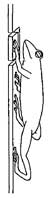
Tree frogs in trees are just fine, but tree frogs on plate-glass windows are better – because then you get to see their slightly icky fascinating undersides.
I must admit, what struck me most when this guy landed – ‘thunk’ – out of a fig tree onto our window in Los Angeles, was how much his (her?) legs looked like raw chicken. I’ve always shied away from those cuisses de grenouille opportunities, but I know the meat is often compared to chicken. Why frogs and chickens developed that way is an interesting question, but not for today’s post.
Rather, now I’m back in the UK , where the frogs are less acrobatic, I’ve tried to figure out how our unexpected visitor managed to cling on.
Wet Adhesion
To understand that for the West Indian tree frog, Oseopilus septentrionalis, researchers Hanna and Barnes1 used active and anaesthetised frogs in experiments that measured the forces they apply walking up vertical surfaces, the angle at which they drop off a gradually inclined surface, and the shear force experienced by an individual toe when the surface it’s attached to is suddenly slid from under it.
The experiments involved placing frogs on a variety of strain-gauge instrumented platforms and surfaces, and making videos of frogs placed on runways and rotating discs of transparent perspex.
The researchers concluded that the primary mechanism tree frogs use to get a grip is exactly the same as that which keeps a sheet of wet paper stuck to the side of a glass: wet adhesion.
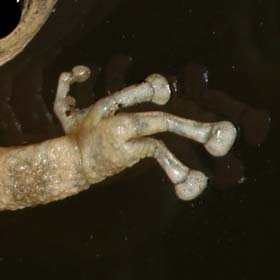
Wet adhesion combines a mix of viscous and surface tension forces, both of which require liquid and, in the case of surface tension, an air-liquid interface. In the tree frog, that liquid takes the form of mucous – wait for it – pumped out the ends of its toes.
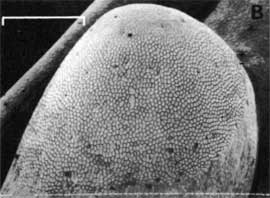
The mucous appears from perfectly smooth-looking toe pads that are actually covered in thousands of peg-like cells between which mucous flows from glands. I can see something going on in my own photographs, but the structure is clear in the SEM picture below.
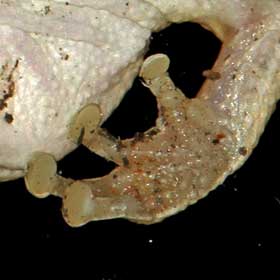
Hanna and Barnes’s also looked at how tree frogs release themselves to move. The frogs peeled rather than pulled their feet off surfaces, the peeling force engaging automatically in forward movement, but not in reverse or when the belly skin of the frog made contact with the surface.
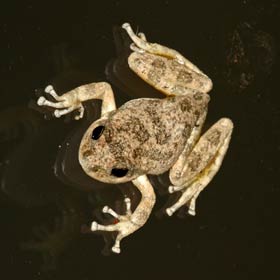
Frogs placed on a slowly rotating vertical disc reorientated themselves to avoid facing downwards – presumably because of the involuntary forward travel or detachment that would induce. At first sight then, my Pseudacris cadaverina appears to defy that rule – because he’s clearly inverted in one of the pictures; but that could be explained by the extra adhesion he’s getting from the inner thigh area – corresponding to the aforementioned belly skin. What’s more, the authors point out that toe pads have developed independently several times in tree frogs, so the observed peeling mechanism may be peculiar to Oseopilus septentrionalis.
I would have liked to spend more time with this little guy, but after about ten minutes I looked up and he’d gone – probably back into the fig tree. But for a while there he sure provided a level of interest, conversation, and intrigue way out of proportion to his size. Ribbit.
Apparatus to measure climbing force
Tree frog toe pad. After Hanna & Barnes, 1991.
References
1. Adhesion and detachment of the toe pads of tree frogs. Gavin Hanna, W.John Barnes. Journal of Experimental Biology 155, 103-125 (1991)
“A squib is a type of firework, hence damp squib: something that fails ignominiously to satisfy expectations; an anti-climax.”
Oxford English Dictionary
The opportunities for non-scientists to do science have never been greater: it’s called Citizen Science.
Helping out the professionals can involve anything from counting ladybirds in your back yard, to looking for alien life, to classifying galaxies and discovering new planets, to monitoring the population dynamics of the Rose-Ringed Parakeet. Just take your pick from the Zooniverse Smörgåsbord.
But when was the first citizen science project? I’ve been thinking about it lately, and my starter-for-ten comes from some research I did last year about fireworks. There must be other examples, so please comment if you have any.
Not to be distracted by definitions (however interesting – see Openscientist), I’m taking citizen science to mean some sort of research or project where a scientist – or what passed for one at the time – appeals to the public to report observations, measurements, or such like.
My candidate project concerns Fellow of the Royal Society (FRS) Benjamin Robins, who in 1748 made a general appeal to the public to observe and report the height of rockets – ultimately with military and surveying purposes in mind – during a firework display.
Without email, podcasts, or Dara Ó Briain’s Science Club, Robins’s request appeared as an anonymous bulletin in the November 1748 issue of The Gentleman’s Magazine1 (in his excellent Fireworks: Pyrotechnic Arts and Sciences in European History2, Simon Werrett suggests Robins is the most likely author)
For if such as are curious and are from 15 to 50 miles distant from London, would carefully look out in all proper situations on the night when these fireworks are play’d off, we should then know the greatest distance to which rockets can possibly be seen; which if both the situation of the observer, and the evening be favourable, will not, I conceive, be less than 40 miles. And if ingenious gentlemen who are within 1,2 or 3 miles of the fireworks, would observe, as nicely as they can, the angle that the generality of the rockets shall make to the horizon, at their greatest height, this will determine the perpendicular ascent of those rockets to sufficient exactness.
The Gentleman’s Magazine1November 1748
Robins had made a name for himself in gunnery and ballistics, calculating for the first time how air resistance affects military projectiles3. Now he enthused over rockets for their
…very great use in geography, navigation, military affairs, and many other arts;1.
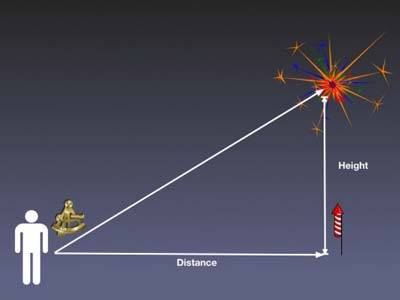
The light alone from a rocket was a useful signal in war; but Robins knew more was possible. Provided the rocket rises vertically to a known height, the observed angle between the horizon and the rocket at the top of its flight lets you calculate its distance. Before GPS and radio, this could tell you where someone was:
The map maker John Senex had already used the method for surveying4, but Robins needed more height and distance data to refine and calibrate the technique. But where would the rockets come from?
As it turned out, Robins’s timing was perfect. Bringing to an end a series of tortuous European wars, the recently signed Treaty of Aix-la-Chappelle was the latest cause for national, and therefore Royal, celebration. And George II planned to celebrate in style, with a sound and light spectacular involving the launch of thousands of firework rockets. The geo-politics of the day were about to lend Robins an unlikely and unwitting hand.
Held at Green Park, London, in April 1749, George’s display, famously accompanied by Handel’s Music for the Royal Fireworks, was huge. No less than 10650 rockets weighing up to 6 pounds each rose into the night sky from a 410 ft long ornate Doric temple or ‘firework machine’5 – 6000 of them reserved to go up together in the finale6.
Giovanni Niccolo Servandoni’s Firework Machine in Green Park 1749, V&A Museum no. 21228, reproduced under Creative Commons 3.0
Robins’ request for two types of data: angle measurements from those close in, and simple confirmations of visibility from those further out, came with instructions:
The observing the angle which a rocket, when highest, makes with the horizon, is not difficult. For if it be a star-light night, it is easy to mark the last position of the rocket among the stars: whence, if the time of the night be known, the altitude of the point of the heavens corresponding thereto, may be found on a celestial globe. Or if this method be thought too complex, the same thing may be done by keeping the eye at a fixed place, and then observing on the side of a distant building, some known mark, which the rocket appears to touch when highest; for the altitude of that mark may be examined next day by a quadrant; or, if a level line be carried from the place where the eye was fixed to the point perpendicularly under the mark, a triangle may be formed, whose base and perpendicular will be in the same proportion as the distance of the observer from the fireworks, is to the perpendicular ascent of the rocket.
The Gentleman’s Magazine1November 1748
Bearing in mind astronomy and triangulation are skills likely absent from most readers’ day jobs, this is quite an intimidating, albeit educational, set of instructions. So much for the procedure; how did the results pan out?
There were some issues on the night, including a large portion of the Doric temple unexpectedly catching fire during the show, and various eye witness accounts suggest the event was a little lack-lustre. But the rockets went up, and George’s spin-doctors took care of any negative PR.
The response to Robins’ experiment was more disappointing, with only one report appearing in the follow up edition of the Gentleman’s Magazine, and that from a Welshman 138 miles away near Carmarthen:
I had a clear prospect of several miles eastward where I waited with impatience till near 10 o’clock, and then saw two flashes of light, one a few minutes after the other, that rose east of me to the height of about 15 degrees above the visible horizon. I don’t pretend that I saw any body of fire, only a blaze of light, which neither descended like a meteor, nor expanded itself abroad like a lightning, but ascended and died. Clouds interrupted, that I could see no more.
At this distance, a line-of-sight view of the rocket at the top of its trajectory is out of the question, thanks to the curvature of the Earth – never mind the Brecon Beacon mountain range. But we shouldn’t write Thomas off just yet. 6000 rockets going off together would make a hell of a flash, and we know lightning from thunderstorms can be seen from many miles away. And in the First World War there were reports of flashes from the fighting in France being visible from London.
In his full letter, Thomas logically argues why his observations could not have been meteors or lightning. Off the technical topic, he then questions the suitability and cost of the event, saying how he struggles to rationalise the irony of using fireworks to celebrate a military cessation. The moaning somehow makes his observations more credible.
All the same, a single response with no elevation data must have been a disappointment to Robins. And just as well he’d taken the belt-and-braces precaution of making some of his own elevation measurements, with the help of a friend stationed 4000 yards away in Cheapside,
Observations from Cheapside
From these measurements, taken with a sextant with the starry background as reference, Robins was able to publish in the Philosophical Transactions of the Royal Society, that the highest Green Park rockets had risen to 8.75 degrees above the horizon, equivalent to a height of 615 yards8.
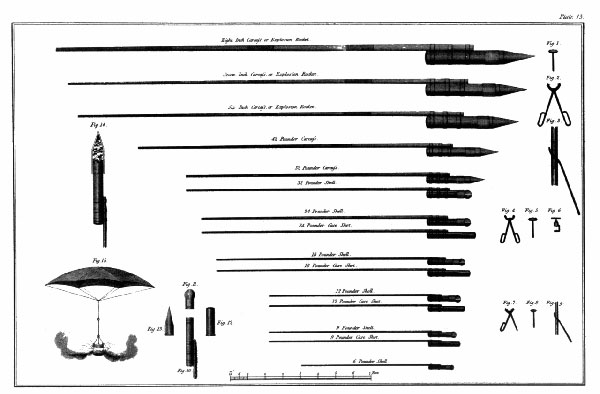
At six pounds, the Green Park display rockets were relatively small
Robins made further tests after the Green Park display, trusting to friends and colleagues placed at various locations tens of miles from London – itself a non-trivial task without mobile phones – and using rockets of more consistent specification9
Robins trusted to friends in further tests
We have to hand it to Robins, that despite a poor public response, his was a valiant effort to stir up interest and participation using the latest communications media available to him.
We should also remember The Gentleman’s Magazine was the first publication of its type (est. 1721) and the first to reach anything like a wide audience – albeit one excluding women and the not so well-to-do. The concept of a publicly visible two-way conversation via a publication was itself recent, having first appeared in pseudo form in the fictional dialogue between characters in the Spectator Magazine (1711-12). So maybe it was just all too new.
These days, I suppose Robins might suggest participants send him a geo-mapped digital photograph of the rockets. Some would understand what they were doing – others wouldn’t – but the data would still be good. But that brings us back to asking exactly who counts as a citizen scientist, which is a whole new question, and probably a good place to stop.
References and further reading
1. ‘A Geometrical Use proposed for ‘the Fire-Works’, Gentleman’s Magazine, Vol 18 Nov. 1748, p.488.
2. Fireworks: Pyrotechnic Arts and Sciences in European History. Simon Werrett, University of Chicago Press, 2010.
3. New Principles of Gunnery, Benjamin Robins, London, J.Nourse, 1742
5. A description of the machine for the fireworks; with all its ornaments, and a detail of the manner in which they are to be exhibited in St.James Park, Thursday, April 27th, 1749, on account of the General Peace, signed at Aix-la-Chappelle, October 7, 1748. Published by His Majesty’s Board of Ordnance. By Gaetano Ruggieri and Gioseppe Sarti.
6. The Mirror of Literature, Amusement and Instruction. Vol 32, 1838, p.66
7. Fireworks Observed. Gentleman’s Magazine, Vol 19, May 1749, pp.217-18
8. Observations on the Height to Which Rockets Ascend; By Mr. Benjamin Robins F. R. S. Phil. Trans. 1749 46 491-496 131-133; doi:10.1098/rstl.1749.0025
9. An Account of Some Experiments, Made by Benjamin Robins Esq; F. R. S. Mr. Samuel Da Costa, and Several Other Gentlemen, in Order to Discover the Height to Which Rockets May Be Made to Ascend, and to What Distance Their Light May be Seen; by Mr. John Ellicott F. R. S. Phil. Trans. 1749 46 491-496 578-584; doi:10.1098/rstl.1749.0109
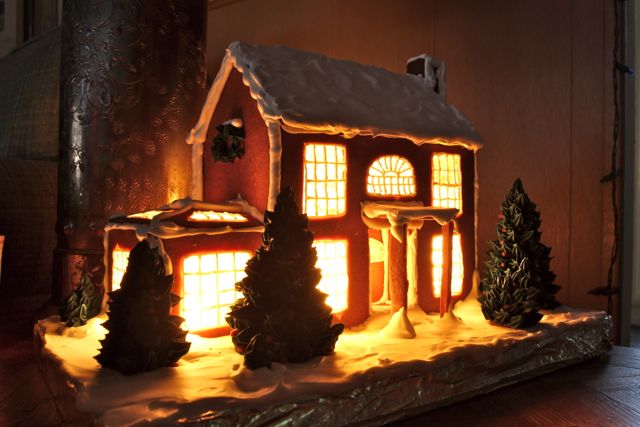
It’s still the holiday season, so no apologies for doodling on about gingerbread, which, as it turns out, can be pretty strong stuff – if a bit bendy.
Cue my wife Erin’s first attempt at a gingerbread house (above). Pretty good, huh? The heat from the incandescent fairy lights has kept it from turning mushy, and nicely spiced up the room at the same time. The house is only eight inches tall, but prompts the obvious question: “How high can you build with gingerbread?”
A structural analysis of a full-on house with walls, windows and doors is too tall an order, even with finite element techniques, so I settled on calculating a ballpark maximum height based on standard engineering equations for a free-standing gingerbread column.
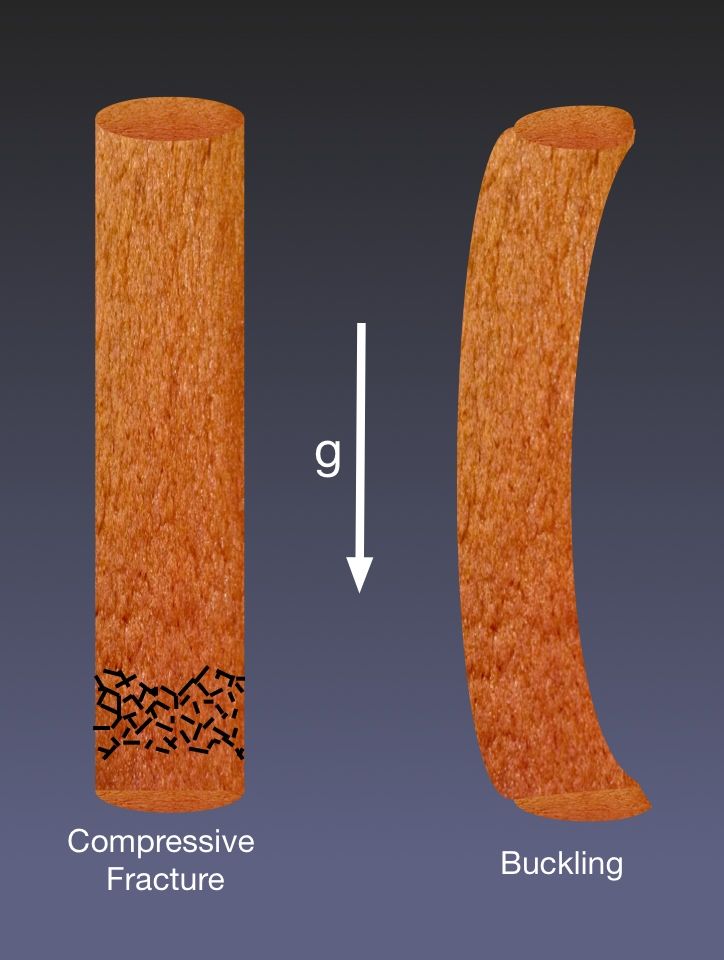
There’s no wind blowing through our lounge, so we can ignore sideways forces and focus on the two likely failure modes a column of gingerbread might suffer – just because of its own weight as it gets taller, i.e.:
(a) the construction materials can disintegrate under their own weight: a function of compressive strength, or
(b) the column can buckle, which is more related to the material’s elastic, or tensile properties.
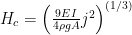
The heights at which these two failures occur can be found from, respectively:
where =column height at compressive failure (m), is the failure pressure (N/m2) = compressive strength of the gingerbread, g=gravity (9.8 ms-2), and is gingerbread density (kg m-3). And for buckling: is the critical height, E is Young’s Modulus of elasticity calculated as tensile stress/strain, I is the Area Moment of Inertia3, and is a factor called a Bessel function, used to solve this type of equation (Ref.2)
Using published gingerbread properties data1 (amazingly, there actually are some) for compressive strength and tensile stress/strain, I calculated values of:
(Workings in box below if you’re interested.)
which essentially means a gingerbread column will start to lean over and buckle sideways long before the gingerbread breaks up through compression under its own weight (I used an arbitrary but realistic 20 cm column diameter). You might think there’s no reason why a uniform, vertical, column would start to lean, but in real life the weight distribution is never uniform and, if the column is sufficiently slim, a turning moment will establish and drive a progressive buckle.
So if you’re going to build a gingerbread house out of free-standing columns, better stop at 3 metres.
Buckling is clearly the limiting factor, but the 3 metre figure is based on a relatively small 0.2m column diameter, and buckling is particularly sensitive to cross-sectional area (whereas compressive fracture of a column under its own weight is independent of area). Also, most real buildings are more complex than a bunch of pillars, and I’d expect the right combination of interconnecting members building up from a broad foundation could reduce buckling potential, making a full-size gingerbread house a reality.
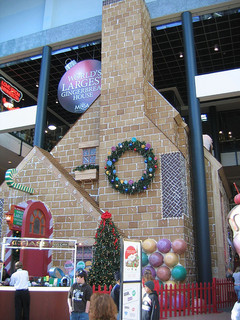
Photo Brian Moen via Flickr
Indeed, the Guinness Book of Records ‘Worlds largest gingerbread house’ is 18.28m (60ft) on a 13.86m by 10.8m base; but closer inspection shows it’s built around a steel frame that presumably keeps incipient buckling in check. But then it’s more of a gingerbread and steel house – a bit of a con really.
Anyhow, our room’s about 3 metres high, so nothing stopping a more ambitious project next year: Empire State Building or Cathédrale Notre Dame ?
Workings
Note that for compressive failure of a column under its own weight, the area of the column A (m2) cancels and isn’t relevant: i.e so, and as above.
I couldn’t measure my own gingerbread density easily (although it for sure floated in water, so < 1000 kg m-3), and used a middle value of 700 kg m-3 from this unlikely study by students at the University of British Columbia (UBC)1. In addition to the UBC data for of 346 kPa, I measured my own value for by pressing a sample (squirrel-shaped in this case, but taking the narrowest foot area as 1*10-4m2) vertically downwards onto a balance and recording when it crumbles.Still intact when the balance read 6kg, I took my to be at least 6 * 9.8 / 1*10-4, or 588 * 103 N/m2 (588 kpascal kPa). In fact, for compressive strength, my numbers and the published data are conservative, as in neither case did the gingerbread actually fail at these values. So:
(UBC data)
(my gingerbread)
Whether it buckles first, at a lower height, depends on the elasticity of the gingerbread and the slenderness of the column: i.e. the ratio of column area to length.
The height at which buckling occurs can be found from Cox & McCarthy2:
where is the critical height for buckling, E is Young’s Modulus of elasticity calculated as tensile stress/strain, and I is the Area Moment of Inertia3.
To calculate , I chose an arbitrary column diameter of 20 cm diameter, and used stress/strain data from the Canadian study1 to calculate E = 9790 kPa; i.e. 219/0.02237 (the change in dimensions of my squirrel under tension are too small to measure with the kit I have).
The Area Moment of Inertia for a circular cross-section , which for a 0.2m dia. column gives . And (, is the appropriate Bessel function of order -1/3 (Ref.2) Note: in the source equation, weight density is specified; hence g added here.) So:
A more complex structure would best be assessed computationally using finite element analysis, but I’m not getting into that.
References
1. ‘Building with gingerbread: Engineering students put holiday delight to the test’ refers to ‘Structural Analysis of Gingerbread. Engineering Design Project Term 2’ by Mercedes Duifhuis and Sean Heisler (pdf)
2. The Shape of the Tallest Column. Steven J.Cox, C.Maeve McCarthy, Society for Industrial and Applied Mathematics. Vol29,No.3. pp.547-554. (Also see Wikipedia page on buckling.)
3. Engineering Fundamentals efunda.com/math)
Historic olla water cooling pots made by Native Americans in San Diego County. Possibly Kumeyaay or Diegueno origin. (Photo:Tim Jones)
Maybe it was the furnace heat of California last month, or the topicality of NASA’s Curiosity landing, but here I am having my first – and almost certainly last – von Däniken moment.
Olla
Mars
How else though, aside from some ancient Martian visitation, could Native Americans of centuries past, without the benefit of telescopes or interplanetary probes, design water pots so closely matching the Red Planet?
Well, on reflection, I guess a mixture of clay and cactus juice might just bake out that way in the sun.
Which brings us to the real science behind these earthenware pots. Because although they may well be over two hundred years old, discovered in 1926 by my wife’s geologist great-grandfather in the desert of San Diego County, these water carrying olla represent nothing less than the world’s first refrigerator.
The larger olla in-situ, San Diego County, 1926, complete with geological hammer for scale. Ollas were not truly ‘fired’, but hardened by baking in the sun (Scan of original photo belonging to Tim Jones)
The water inside the olla reaches a temperature substantially below that of the surroundings thanks to the principle of evaporative cooling – something you can demonstrate to yourself just by licking a finger and waving it around. The skin feels cooler because the heat needed to turn liquid water molecules in your spit into vapourised water molecules leaving your hand is taken from your skin. The amount of heat, or energy, needed to change from a liquid to a gas is called the latent heat of evaporation, which for water is 2257 kJoules per kilogram.
Kumeyaay (Wikipedia)
The sun-baked porous clay of the olla acts like a wick, delivering a constant flow of evaporating water to the surface where it quickly evaporates, cooling first the surface and in turn the water inside the pot.
Wondering how effective ollas really are, but with live tests on our delicate pots off the agenda, I turned to theoretical musings and some (not entirely successful) experimentation.
The Theory
The temperature on the pot’s surface, or wet-bulb temperature, is easy enough to calculate if we know the ambient air temperature, relative humidity (how much water is already in it), and local air pressure – as that affects the dew-point temperature at which water changes from liquid to gas. I got all that info from my local weather station online, and plugged it into one of the many online calculators – like this one at the National Oceanic and Atmospheric Administration (NOAA) – to find the wet bulb temperature. (The exact calculation is complex and explained on the NOAA website, but essentially the drier the air, the lower the wet-bulb temperature; water molecules already in the air decrease the net evaporation rate.)
The day I looked at this, the values were: temperature 34 C, relative humidity 20%, and air pressure 1014.9 millibars, for which the NOAA calculator returned a wet-bulb temperature of about 19 C. That’s a whole 15 degrees below ambient temperature; modern electric fridges don’t do much better than that (okay – granted they can get to lower absolute temperatures).
Wet-bulb thermometer (Photo:Tim Jones)
The wet-bulb temperature I verified experimentally using a cooking thermometer modified with wet paper-towel stuffed in around the sensor tip (a mercury thermometer would have a bulb of mercury at the end – hence wet-bulb; but this was all I had and works well enough). Swinging the thing fast round my head on the end of a shoelace simulated wind and, lo and behold, I recorded a wet-bulb temperature of 21C. Not quite the predicted 19C, but in the right area.
Good ventilation of the olla is necessary as it influences the evaporation rate, and the area for evaporation should be large (the olla’s spherical design is fantastic in this regard as it maximises the area). The area of non-wetted contact should be small to minimise absorption of heat by conduction from the surroundings – here again, the point contact of the spherical olla is perfect. Ollas also work better in the shade, to minimise heating by solar radiation.
Calculating how long the contents take to cool is more tricky, requiring an estimate of the evaporation rate from a porous surface. But we can get some handle on it using an assumed rate of 7kg/m2.day (based on some data I found for swimming pool evaporation rates in Australia of all things), latent heat of evaporation of water 2257 kJ/kg, and heat capacity of water 4.18 kJ/kg.K. From which I reckon the 0.3m diameter olla, holding 14 litres (=14 kg) of water, needs to lose 878 kJ of heat to fall in temperature by 15 degrees, equal to evaporating 0.4 litres (0.4kg or 3% of the contents) from the 0.28 m2 surface over a 5 hour period.
The numbers aren’t perfect, but suggest in its heyday our olla was up and usefully cooling in a couple of hours.
The Practise
Now for the not-totally-successful experimentation part of the post.
Plant pot evaporative cooler (Photo:Tim Jones)
You can see what I’m trying to do here: my very own plant pot olla. The physical conditions (temp.,humidity,pressure) were the same as the theoretical calculation; and I’d confirmed a wet-bulb temperature of 22C as described above. The pot was kind of working too; that dark band in the middle and top is water seeping through the porous terracotta – and it was pretty consistent throughout the experiment.
Stirring the contents and taking regular measurements indicated a one degree fall over the first two hours. But then the temperature started to climb again, which suggests the pot was just not porous enough over sufficient area to counter heating by conduction through the non-wetted areas. A lack of wind won’t have helped – maybe use a fan next time. At least no one can accuse me of selectively publishing only positive results.
Other Coolers
The Arab Zeer works in a similar fashion to the olla, but consists of two pots separated by wet sand. Fruit and other perishables can be kept fresh in the central pot.
Pot-in-pot, Zeer type evaporative coolers (Wikipedia)
A modern invention is this Terracooler: an evaporatively cooled terracotta bell-jar placed over food to keep it fresh.
Evaporative cooling in water features is enhanced by an electric pump (Photo:Tim Jones)
And keep an eye out for artificial waterfalls used to create a cool atmosphere in public spaces, or the same principle operating in simple garden water features: the water in this one I measured at 24C on a 32C day.
I’m back in the UK now, where typical humidity levels close to 100% (=rain) preclude the extensive program of further evaporative cooling tests this discussion clearly signposts. If you have more luck with your own ollas though, do let me know.
It’s that candlelit dinner stage of the evening. Soup through nuts, you’ve been your wonderful, genuine, self. And he/she is pretty fantastic too.
Spectrum of candle flame by diffraction in a CD (Photo:Tim Jones)
But why take chances – this is deal clinching time.
With the table cleared, quick as a whippet you pull out your Ethereal Collapse CD, and with a flourish Newton would die for if he wasn’t already dead, guide your beloved’s eye to the spectacular demonstration of spectra by diffraction.
Your friend will by now be in a frenzy of excitement, so this is the moment to push them over the edge.
Rushing through to the restaurant kitchen with a mix of urgency and discord normally reserved for Bond movies, you thrust your CD into the light once again. But now the disc reflects the chef’s fluorescent tube in an almost unbearably different, and extremely interesting way. The smooth continuum of the candle flame is gone! Now superposition bands stand proud, where line discharge spectra from gaseous mercury inside the lamp combine with the continuous spectra emitted from the phosphor coating.
Spectrum of fluorescent lamp by diffraction in a CD (Photo: Tim Jones)
At this point, you’ll almost certainly be offered complimentary Cognacs – if only to leave the kitchen. But by now you’ll both be itching to get off anyway, back to his/her flat to repeat the experiments under controlled conditions. Or maybe play some Scrabble.
“in Sensation we believe external Things exist, in Memory we believe they were, in Imagination we neither do the one nor the other” (Erasmus Darwin quoting poet Richard Gifford back to himself in a letter of 1768.)
Here’s something to try if you haven’t already done it: make a Google Street View tour of all the old homes you’ve ever lived in.
Of course, if you’ve yet to leave the parental home it’s going to be a dull exercise, but if you’ve been around a while and lived in lots of different places, there’s the joy of reminiscing and spotting that the new owners have gotten around to replacing that leaky porch you ignored all those rainy winters.
Street View hasn't caught up with the Belgians - or vica versa
It took me half an hour to track down the twelve places I’ve lived in, bought, or rented over the years (some in the pic above); although the flat I lived in for four years in Brussels came out as, well, flat. Belgium seems to have been overlooked by Google Street View)
Apart from the idle interest, dredging the past evokes ideas around the concept of time and how we store information and remember things; although if that’s just me, it’s because I’m presently transitioning between two books that touch on the topic: The Information by James Gleick and Jon Turney’s Winton Prize-longlisted The Rough Guide to the Future.
We capture so much nowadays – Gleick: “The information produced and consumed by humankind used to vanish – that was the norm, the default. The sight, the sounds, the songs, the spoken word just melted away.”
Then came the first marks on paper, drawings, writing; then photographs. Gleick again:
“Now expectations have inverted. Everything may be recorded and preserved, at least potentially: every musical performance; every crime in a shop, elevator, or street; every volcano or tsunami on the remotest shore; every card played or piece moved in an online game; every rugby scrum and cricket match.”
Whether it’s Street View, Flickr, or Friends Reunited, there’s a bunch of stuff pushing in on us, persuading us to reconstruct our pasts in a way that was alien even five years ago.
What does it mean? Is it good?
For sure, any ideas we might have had about ‘clean breaks’ and ‘moving on’ get a good muddying. Old friends: material and personal, reappear unbidden – sometimes welcome, othertimes unsettling away from their original context.
In his chapter About Time, Turney says our memories impact our ability to think about the future; afterall, past experience is pretty much all we have to draw on.
The way we build memories, he says, may have adapted specifically to enable the efficient anticipation of new situations, and there is even evidence of a physical link in how we think about past and future events – neurological scans revealing common areas of brain activity.
Our memories “seem to work by storing individual pieces of past experience separately, as part of a complicated, interconnected web …. Our brains then assemble recollections of past episodes by adding together bits of information that seem to be related.”
As it happens, by Turney’s reckoning, I’m probably at the optimum age for projecting possible futures. Meaning, I’m old enough to have collected some experiences, but not so old I’ve forgotten them all. (I love some of the terminology people use for age brackets, particularly the ‘old old’ – meaning over 80. At 49, I’m holding out for ‘young middle-age’.)
I want to wind up the post by sharing some great life-changing revelations resulting from this technology-induced disturbance in my mental time-space continuum and reassessment of ‘self’. But as the most emotionally charged evocations seem to relate to the unfeasible number of lawnmowers I’ve owned over the years, I’ll skip on that and instead leave you with a bit of topical DNA:
Figure 1 - Sand Martin approaches from rear of convoy
Figure 2 - Sand Martin passes over second duck in convoy
When I lived in the Midlands of the UK, away from the bussle of London’s controlled airspace, one of my pleasures on an evening was to hire a light aircraft at my local airfield and tootle off for an hour or so practicing maneoveurs and generally enjoying the sunset – all very peaceful.
Except, one evening when I was out tootling above the Cotswolds; like a flash, an RAF Tornado jet whooshed from under me, matching my track but far exceeding my speed, and all uncomfortably close – a disappearing dot before I could blink.
In fact, he was probably a good 500 ft below me and certainly had on-board radar – so nothing actually dangerous going on. (There’s a popular myth – that may be true – that on such occasions the military use light aircraft for practice interception.)
Anyhow, it made an impression on me, and today the memory returned unbidden with these two photographs snapped at the Rick Pond in Hampton Court Park. They show a Sand Martin in a low-level, high speed pass over a convoy of ducklings – as bemused, no doubt, as I was 4000 feet above the Cotswolds (Figs 1 & 2).
Low-flying Sand Martin (Riparia riparia) with Mallards
I’d been trying to catch the Martins’ aerobatic fly-catching with no success, and started snapping the ducks more as a gesture of resigned failure. I only spotted the Martin when I downloaded the flash card.
This type of ‘buzzing’ seems to be in the Sand Martin’s nature. People on the bank get similar treatment – the bird coming from behind, passing within inches of heads, as if honing their own targeting systems.
I’d left the camera in rapid fire mode of 8 fps, so the time interval between the two photographs is known. If we also know the length of a duck, we can calculate the Martin’s speed, in ducks per second – or more tedious conventional units. So:
Assuming SML = 0.3m (Standard Mallard Length)
Time between pictures at 8 f.p.s = 0.125 s
Ducks passed between frames = 5.75 (use the grid to measure; one duck = 2 grid squares)
Q – What did the grape say when an elephant stepped on him?
A – Nothing. He just let out a little wine.
The first alcohol I ever drank was home brewed. I was twelve when the evil liquor – orange and raison wine – was served up by my refreshingly enlightened policeman uncle of all people. We’d visit the house and find these wort-filled vessels in the bathroom, glug-glug-glugging as bubbles of carbon dioxide chugged through little glass airlocks.
Not that I was swilling the stuff in quantity you understand, but what better introduction to the practical application of biochemistry and chemical engineering. Who knows what influence these little episodes have on later life decisions?
Six years later, as an impoverished student at Birmingham University, I was brewing my own 40 pints of barely drinkable delicious Mild Ale (pronounced ‘m + oiled’ in the local dialect). And while I never got into the brewing habit big time, I still on occasion reach for the demijohn and yeast – like recently, prompted by the promise of summer blackberries and the pungent whiff of Thames-side hops.
It’s obvious booze is an educational resource we ignore at our peril; but to consolidate, consider what’s going on in that murky ochre, as it sits in my hall, infusing the carpets and curtains with its fruity ambience. I hope it’s this:
The contents of the bottle are yellow because the blackberries haven’t actually appeared yet, so for now I’m using Chardonnay grape concentrate out of a can. And as that contains fructose from the grapes plus added glucose syrup, and I’m adding sucrose on top of that, both reactions should have kicked off immediately – the whole thing enabled by one of my favourite eukaryotic micro-organisms – Saccharomyces cerevisiae: a wine yeast.
There’s nothing to do now until it ferments out, but I managed to kill 20 minutes using the chemistry and bubble rate data to figure out how things are ticking along. I reckon I’ll produce 511g of alcohol and 488g (273 litres) of CO2, which at the current bubble rate means the fermentation will take 6 days (workings in the end-notes for those interested and assuming I’ve remembered my O-level chem.).
We covered production of ethanol from fermentation at school, but I don’t remember doing any distillation (which is illegal without a license in the UK). Certainly nothing to compare with the alcohol education afforded 1960s American youth courtesy of the fabulous Golden Book of Chemistry Experiments (excerpts below), which covers fermentation with yeast plus the distillation/synthesis of ethanol, methanol, and a bunch of other fun compounds from the ethanol ‘Family Tree’:
I love the helpful precautionary note on chloroform:’THEN SNIFF CAREFULLY’. A complete home schooling if ever there was one:
That’s all really. I’ll update with a report on the finished product, assuming the wrong types of bug and oxygen don’t intervene and vinegarate the show.
One last item though. Yeast is of course also used in baking; the carbon dioxide from fermentation causes dough to rise. So here’s a particularly rigorous explanation of the process from Alton Browne. It’s over my head, but I’m sure the trained biochemists out there will relate. (Quality isn’t up to much either – sorry about that.)
Guessing there’s about 300g of glucose in the concentrate, and I know I’ve added 450g sucrose to 5.5 litres of water. As 1 Mole sucrose (242g) yields 2 Moles glucose/fructose (360g), 450g sucrose will make 669g glucose/fructose. With the 300g in the syrup that rounds up to about 1000g total C6H12O6. 1 Mole of C6H12O6 (180g) makes 2 Moles ethanol (92g) plus 2 Moles carbon dioxide (88), so 1000g should make 511g of alcohol and 488g carbon dioxide. That’s roughly half a kilo of alcohol in 5.5kg water, or, ignoring the density difference, about 10% by volume . These kits supposedly deliver 12%, so the 300g estimate was probably low. The volume of gas produced can be calculated given 1 Mole CO2 (44g) has a volume of 22.4 litres at STP (24.6 at current 25deg C room temp), so our 488g equates to 273 litres of gas having to bubble through the airlock. It’s bubbling at about 1 per second with an estimated bubble volume of half a cm3 ; so I figure at that rate it will take 6 days to ferment out. All of which seems to hang together with what it says on the tin.
With a diameter of 120,000 kilometres and a bright reflective surface, Saturn is an unmissable object in the night sky right now. But at 1.3 billion kilometres away from us, it looks only a hundreth the size of the full moon. Which means the screen width of my Saturn video below represents one third of a lunar diameter across (for best view, click to full screen):
[jwplayer mediaid=”9786″]
I recorded the movie through my old but capable 1978-vintage 6″ Fullerscopes reflector – specially resurrected for Easter after 30 years in storage. (See my efforts with the moon and the smaller ETX-90 telescope in Armchair Astronomy.)
Fullerscopes 6″ at left, after the clean-up, ETX-90 at right
Getting the telescope up and running really required nothing more than (literally) brushing away some cobwebs and giving the mirrors a wash – something I’d be more hesitant of doing had I not just read a step-by-step ‘how to’ in Sky at Night magazine.
Dirty mirror
Diagonal
Although thick with dust and grime, I’d reason to believe the mirrors’ coatings beneath were o.k., as I remember having them vacuum re-aluminised and silica coated just before I abandoned the instrument and disappeared off to university. Some gentle soaking, swabbing, and rinsing down with distilled water, and all was shiny once again.
Cobwebs
Before
Fullerscopes’ german equatorial mountings were all built like tanks – this ‘Mark II’, rated to carry a 10″ reflector, is still in good order save for some rust on the exposed steel shafts.
The RA drive, that ordinarily would drive the telescope counter-rotational to the Earth’s axis, wasn’t operational for a variety of reasons; but the fine adjustment on the declination axis was working.
Fullerscopes Mk II Equatorial Mount
All of which goes to explain why on the clip Saturn appears to fly across the screen.
Soaking
I’d forgotten how stunning to the eye Saturn is through this telescope. In better seeing conditions I’ve seen the gap in the rings – the Cassini Division – quite clearly. Now, Saturn’s moon Titan was unmistakable.
Filming what you see with your eye is a little more challenging, although the ‘live view’ on the Canon 7D makes life a lot easier. Rather than watch the live feed through a computer, on this occasion I used the camera’s LCD display directly to focus with the help of a magnifying glass. The clip was made by projecting the image onto the camera’s CCD sensor via a 12.5mm orthoscopic eyepiece; the main mirror’s focal length is about 1250mm. The scene could have stood higher magnification, but I was limited by the eyepiece focal length and size of the projection tube.
Good as new
All in all, considering the state of the equipment at the start of the day, I’m happy with the end result. The gap between the disk of Saturn and the rings is clear enough; but no Cassini division – so still some work to do! All the same, a fun day messing around with telescopes and engineering – no better way to spend the Easter hols.
2. To be exact: the angular size of Saturn on 25/4/2011 was 19 seconds (“) of arc, approximately a third of a minute. There are 60 seconds in a minute, and the moon is typically 30 minutes across; so Saturn appears one ninetieth of the moons diameter.
You may be aware of the mini-controversy around what was initially thought to be a ‘mystery missile’ launch earlier this week off the California coast. This clip sums it up:
The official line now seems to be that it wasn’t a missile at all, but the vapour contrail from a passenger jet, the sunset and viewing angle making the event look like something it wasn’t. Last time I looked, NASA were reported to be supporting that view based on satellite imagery, and a specific aircraft has been correlated with the event.
The incident reminded me that things are indeed not always as they seem, especially in the sky around sunrise and sunset. And to illustrate, I’ve dug out a few pictures – all taken in the last three months.
One thing that really struck me in the mystery missile film was the ‘solidity’ and volume of the plume. Aircraft contrails are more wispy aren’t they? But then I looked at this picture I took just before sunrise, which includes a contrail every bit as bushy as the one in the film:
Contrails over Surry, UK (Photo: Tim Jones)
Perspective too is a funny thing. Take a look at this picture I took of a passenger jet near Heathrow Airport in London just as the sun was setting.
Passenger Jet (Photo: Tim Jones)
It’s not immediately obvious, to me at least, whether this plane is coming at me or flying away. There’s a Gestalt Switch moment when the eyes confuse the rear of the fuselage for the nose end. Things don’t get much clearer when we zoom in:
Passenger Jet (Photo: Tim Jones)
A few seconds later and the setting sun catches the plane’s tail, making the direction of flight more obvious. At a distance, could such a bright reflection isolated to one part of an aircraft be confused with a rocket nozzle – especially if you’d already got the idea in mind?
Sun reflecting off aircraft tail-fin (Photo: Tim Jones)
It’s easy to be fooled by bright objects catching the sun. Helium filled toy balloons are favourite UFO candidates. I’ve more than once rushed into the house for camera and binoculars when something fast and bright has appeared in the sky. The motion of a rising balloon is very smooth, and viewed from the right angle the mystery object can appear to travel horizontally across the sky faster than it really is. The last one I saw reminded me of an International Space Station (ISS) pass, only in daylight. Again, one of the issues I have with the mystery missile film is that I can’t tell how fast the missile / aircraft is moving – vertically or horizontally.
Shiny balloons make for great UFOs (Photo: Tim Jones)
Here’s another example of skyward things not being all they at first seem. To the naked eye, we see a typical multi-engine passenger jet flying at high altitude.
Aircraft contrail illusion (Photo: Tim Jones)
But with the benefit of a telephoto lens, it turns out to be three (presumably military) jets flying in formation:
Three jets in formation, showing contrails (Photo: Tim Jones)
Something else that isn’t clear from the mystery missile footage is the absolute and relative position of the helicopter that took the pictures. Again, perspective can be confusing. Take a look at this shot I took looking down on a plane in the clouds. Obviously I took this from the air, right?
Jet plane against clouds (Photo: Tim Jones)
Wrong. I was standing in the local park (and it’s not a hilly region) when I took this. A bird flying into the frame puts some limits on the likely altitude, but it’s still ambiguous if you don’t see the full context:
Jet plane against clouds (Photo: Tim Jones)
To finish off, here’s a picture I took only a couple of weeks ago from mountains over-looking Los Angeles and the bay area. It was twilight, and that lump above LA Downtown is Catalina Island. Perfect missile-spotting conditions. Maybe I’ll catch the next one.
View over Los Angeles and out to sea (Photo: Tim Jones)
UPDATE 13/11/2010
Comprehensive analysis of this event and discussion of previous missile/aircraft contrail confusions here at Contrailscience.com.
This website uses cookies to improve your experience while you navigate through the website. Out of these, the cookies that are categorized as necessary are stored on your browser as they are essential for the working of basic functionalities of the website. We also use third-party cookies that help us analyze and understand how you use this website. These cookies will be stored in your browser only with your consent. You also have the option to opt-out of these cookies. But opting out of some of these cookies may affect your browsing experience.
Necessary cookies are absolutely essential for the website to function properly. This category only includes cookies that ensures basic functionalities and security features of the website. These cookies do not store any personal information.
Any cookies that may not be particularly necessary for the website to function and is used specifically to collect user personal data via analytics, ads, other embedded contents are termed as non-necessary cookies. It is mandatory to procure user consent prior to running these cookies on your website.


")


 =column height at compressive failure (m),
  is the failure pressure (N/m2) = compressive strength of the gingerbread, g=gravity (9.8 ms-2), and
  is gingerbread density (kg m-3). And for buckling:
  is the critical height, E is Young’s Modulus of elasticity calculated as tensile stress/strain, I is the Area Moment of Inertia3, and
  is a factor called a Bessel function, used to solve this type of equation (Ref.2)
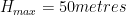

 so,
so,  and
and 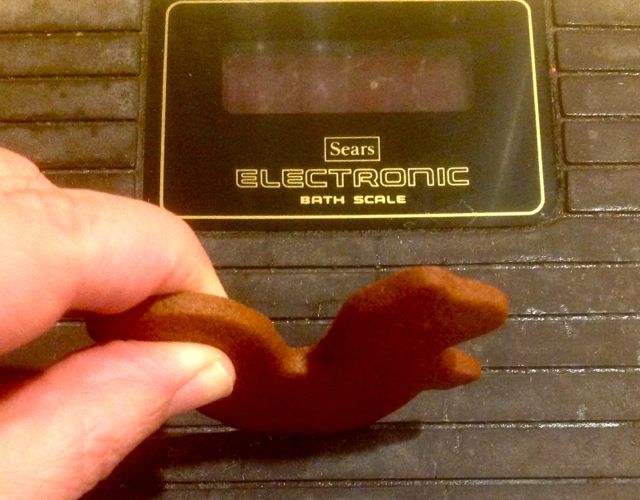
 (UBC data)
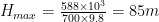 (my gingerbread)
 , I chose an arbitrary column diameter of 20 cm diameter, and used stress/strain data from the Canadian study1 to calculate E = 9790 kPa; i.e. 219/0.02237 (the change in dimensions of my squirrel under tension are too small to measure with the kit I have).
 , which for a 0.2m dia. column gives
  . And (
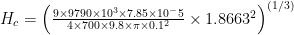

")


")


")
")
")
")
")
")
")
")
")
")